Indonesia: From Low Income, High Poverty to High-Income, No Poverty?
v\:* {behavior:url(#default#VML);}
o\:* {behavior:url(#default#VML);}
w\:* {behavior:url(#default#VML);}
.shape {behavior:url(#default#VML);}
In this blog post and video, Andy Sumner examines Indonesia’s remarkable growth and speculates on what may be possible by 2025.
72
1024x768
Normal
0
false
false
false
EN-GB
X-NONE
X-NONE
/* Style Definitions */
table.MsoNormalTable
{mso-style-name:"Table Normal";
mso-tstyle-rowband-size:0;
mso-tstyle-colband-size:0;
mso-style-noshow:yes;
mso-style-priority:99;
mso-style-qformat:yes;
mso-style-parent:"";
mso-padding-alt:0cm 5.4pt 0cm 5.4pt;
mso-para-margin:0cm;
mso-para-margin-bottom:.0001pt;
mso-pagination:widow-orphan;
font-size:11.0pt;
font-family:"Calibri","sans-serif";
mso-ascii-font-family:Calibri;
mso-ascii-theme-font:minor-latin;
mso-fareast-font-family:"Times New Roman";
mso-fareast-theme-font:minor-fareast;
mso-hansi-font-family:Calibri;
mso-hansi-theme-font:minor-latin;
mso-bidi-font-family:"Times New Roman";
mso-bidi-theme-font:minor-bidi;}
v\:* {behavior:url(#default#VML);}
o\:* {behavior:url(#default#VML);}
w\:* {behavior:url(#default#VML);}
.shape {behavior:url(#default#VML);}
As is well known Indonesia has achieved drastic improvements in average incomes and in the reduction of poverty. Much research has discussed this progress using national poverty lines and in recent years there discussion has focused on slowing rates of poverty reduction and how to maintain rates of reduction to meet the National Medium-Term Development Plan national poverty target of 8–10% by 2014.
In a new paper, presented recently at the Forum Kebijakan Pembangunan (video above), we take an alternative and complementary perspective to illustrate what is plausible up to 2030.
We discuss trends and patterns of poverty reduction by using the international poverty lines ($1.25 which is now close to the National Poverty Line, as well as $2 and we add $10/day PPP). We use a new model of growth, inequality and poverty for historic estimates and project forward poverty reduction patterns by various growth and inequality trends in order to ascertain the range of possible future levels for poverty.
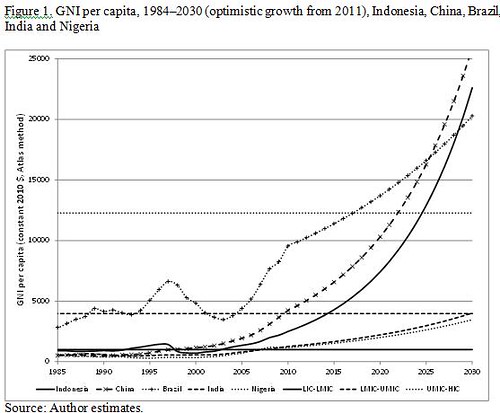
What does historical and forecast analysis of Indonesia’s growth, inequality and poverty using international (PPP) poverty lines tell us? First, it is plausible that Indonesia may attain high-income country status in a decade or so (see figure 1). However, historical growth rates would probably err towards caution and perhaps 15 years or longer is more likely.
72
1024x768
Normal
0
false
false
false
EN-GB
X-NONE
X-NONE
/* Style Definitions */
table.MsoNormalTable
{mso-style-name:"Table Normal";
mso-tstyle-rowband-size:0;
mso-tstyle-colband-size:0;
mso-style-noshow:yes;
mso-style-priority:99;
mso-style-qformat:yes;
mso-style-parent:"";
mso-padding-alt:0cm 5.4pt 0cm 5.4pt;
mso-para-margin:0cm;
mso-para-margin-bottom:.0001pt;
mso-pagination:widow-orphan;
font-size:11.0pt;
font-family:"Calibri","sans-serif";
mso-ascii-font-family:Calibri;
mso-ascii-theme-font:minor-latin;
mso-fareast-font-family:"Times New Roman";
mso-fareast-theme-font:minor-fareast;
mso-hansi-font-family:Calibri;
mso-hansi-theme-font:minor-latin;
mso-bidi-font-family:"Times New Roman";
mso-bidi-theme-font:minor-bidi;}
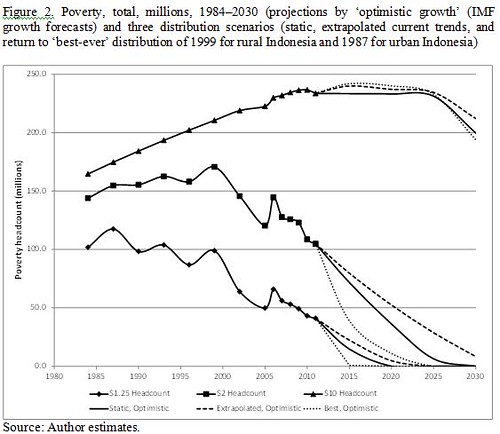
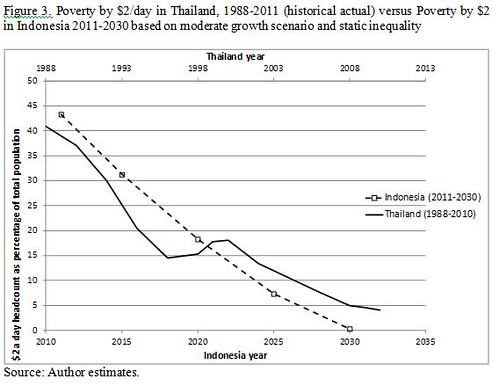
Second, it is also plausible that Indonesia could end $1.25/day and $2/day poverty in the same time frame if growth meets IMF forecasts and there is a favourable distribution movement (see figure 2). Again current and historic trends suggest this is highly optimistic in terms of growth and inequality. An alternative way of looking at this is that the opportunity cost or current inequality trends is 10-20 more years to end poverty in Indonesia. In terms of comparison, the historical ‘moderate’ growth and static inequality achieved by Thailand may be of interest to policy makers in Indonesia (see figure 3).
Third, however, we note that a large proportion of the population may find themselves between day-to-day poverty and security from poverty (defined here as the $10/day line). Fourth, we also note that poverty by international poverty lines seems to be far more urban and on a steep trend to a greater urban proportion of poverty.
How different our findings using the international poverty lines compared research using the national poverty line?
Research using national poverty line(s) - meaning non-$PPP lines - has concluded that absolute poverty declined during the Soeharto years. However, poverty was still significant before the 1997/8 financial crisis, and may have been underestimated. Further, welfare improvements slowed in the period after the 1997/8 crisis.
Using consistent international poverty lines at $1.25 and $2 (recalling the former of which is close now to the national poverty line), we find over the 1984-2011 period that $1.25/day poverty significantly declined during the Soeharto era. However, the substantial decline of $2 poverty/day seems to largely date to the post-Soeharto era and the $10/day poverty count appears to have changed surprisingly little in 25 years according to the data. It is true that even before the 1997/8 crisis poverty was still at high levels (more than 40% of population by the $1.25/day poverty line and 80% of population by the $2/day poverty line).
We find the rate of poverty reduction by $1.25/day and $2/day was particularly fast in the period 2000-2005, indeed faster than in the pre-crisis time and possibly reflecting the range of social programmes introduced or extended in the post-crisis period. However, that rate of poverty reduction is slower since the 2005/6 rice price induced poverty spike, notably for the $1.25 poverty count and somewhat for the $2 poverty count.
Studies focused on the long-run relationship between expenditure poverty and economic growth using national poverty line(s) have found that overall, economic growth in Indonesia has benefited the poor.
We find over the 1984-2011 period that the benefits of growth to those under $2 have been substantial. Indeed, economic growth certainly appears to have benefited the poor substantially using the $1.25 or $2 poverty lines and overall growth has been broad-based with regard to the lower end of the distribution and Indonesia compares well to other populous countries (See figure 4).

crisis, inequality was relatively low or declining and that inequality did not increase drastically as a result of economic growth whilst others have found inequality was high or increasing pre-crisis. Further, many have noted that inequality has increased post-crisis.
We find that total inequality (measured by the Gini and Theil) fell in the early 1990s (although this masked rising urban inequality as it was rural inequality that fell substantially). However, post-1997/8 crisis inequality has risen in two waves in particular: one wave visible in the data for 1999-2005 and a more recent wave 2009-2011. Rising inequality could slow not only poverty reduction but the rate and longevity of future economic growth.
In sum, it is plausible that Indonesia could be a high-income country by 2025 with little $1.25 or $2 poverty. This is though an optimistic view based on strong economic growth and favourable movements in distribution. Slower growth and/or rising inequality would, of course, however delay the end of poverty. The purpose of such projections is merely to illustrate what is possible.
Andy Sumner is Co-Director of King’s International Development Institute, a newly established institute that has a focus on the emerging economies. This blog was originally posted on the ANU Indonesia Project blog. For more of Andy's writings on this subject please see: Poverty, Geography and the Double Dilemma.


