Are Catastrophic Disasters Striking More Often?
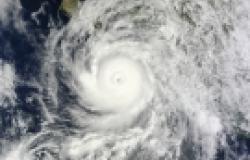
No sooner had Hurricane Harvey’s record rains receded from Houston and neighboring cities than the residents of Florida began bracing for a wallop from an even more powerful storm. And hurricane season hasn’t even peaked yet.
This begs the question: Is the number of major natural disasters striking the United States actually increasing, or does the media’s natural tendency to overhype conflict only make it seem so?
The federal government’s National Oceanic and Atmospheric Administration actually maintains a website that can help answer this question. Its list of billion-dollar disasters goes back to 1980 and records the date, location, number of deaths and total cost of each one.
As an economist, I take a different approach from how a climate or environmental scientist might answer the question. Major disasters can wreak tremendous damage, such as destroying wild habitats, rerouting major rivers and killing innocent people. However, assigning specific values to these kinds of damages is difficult.
Assessing the direct economic damage of a disaster is comparatively simpler. Insurance companies and government agencies receive damage and loss claims for specific amounts. These figures are then adjusted to account for the uninsured to produce a total.
In my own analysis, I will start with these figures but make an additional adjustment which I believe more accurately answers whether catastrophic disasters are indeed occurring at a greater frequency.
How the government tracks disasters
The government has gone to great efforts to make sure its disaster data are reliable by combining data from government agencies like FEMA, the USDA and private insurance claims.
And it doesn’t just track the hurricanes making headlines right now, but all kinds of large disasters, from winter storms and heat waves to droughts and floods. The data also include winters when subfreezing temperatures destroy billions of dollars of crops and kill large numbers of livestock.
The government ensures the costs are measured accurately. The total cost of each event includes both losses covered and not covered by insurance. The losses include damage to buildings, roads and infrastructure, as well as items destroyed within buildings when a major disaster strikes. The figures also include some amounts lost by businesses because they were temporarily forced to shut down.
The figures, however, do not assign any value to lives lost. Even if a storm kills hundreds, no adjustment is made for these deaths.
Finally, the figures are adjusted for inflation. This is very important because US$1 billion in 1980 is actually equivalent to $3.15 billion today after adjusting for price changes. Hollywood movies consistently break box office records because the industry does not adjust ticket sales for inflation. Without an adjustment, disasters would consistently look more expensive over time and, like Hollywood films, seem to always shatter records for damage – even when they don’t.
What the data show
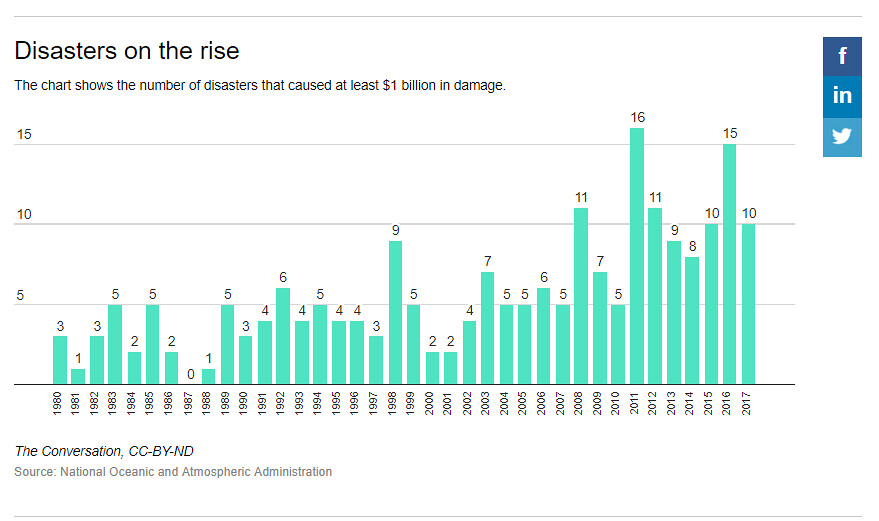
Since 1980 there have been 212 disasters, which NOAA calculates resulted in over $1.2 trillion in damage.
My analysis of the NOAA data shows that the number of billion-dollar disasters has indeed been increasing over time. A typical year in the 1980s experienced on average 2.7 such disasters in the U.S. In the 1990s and 2000s, that average had climbed to 4.6 and 5.4 a year, respectively.
Since then, the frequency of costly disasters has soared. In this decade so far, each year has seen an average of 10.5 disasters. The scale of this increase amounts to one additional billion-dollar disaster every four years.
Do the numbers present a true picture?
Even with the inflation adjustment, a key reason we have more costly disasters is simply that the economy is much bigger today than it was in the 1980s.
When the economy was smaller, disasters caused less economic damage. There were fewer homes, factories and office buildings to destroy, so it was harder for a natural disaster to cause a billion dollars of damage.
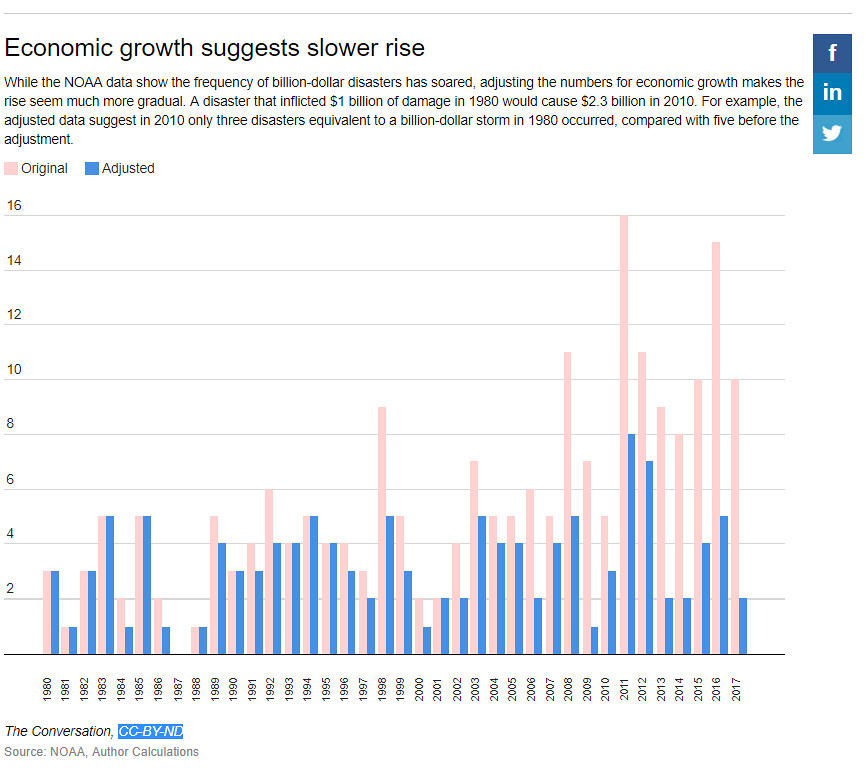
Since 1980, the U.S. economy has more than doubled. The economy grew from $6.5 trillion back then to $17 trillion as measured by inflation-adjusted GDP. To account for this, the NOAA data should be adjusted for the economy’s size. In other words, a storm happening today will cause more damage than an identical one occurring decades earlier simply because there is more to destroy.
A simple adjustment that incorporates economic growth divides each year’s inflation-adjusted GDP figure by the 1980 value and multiplies the answer by $1 billion. This results in a figure, in each year, that equates to the minimum amount of damage needed to be economically equivalent to $1 billion of destruction in 1980.
For example, the resulting figure for 2010 is $2.3 billion. Or put another way, a storm that caused $1 billion in damage in 1980 would have caused about $2.3 billion worth in 2010.
While this isn’t a perfect adjustment and assumes all parts of the economy grow at roughly the same rate, it creates a more accurate measure of meaningfully billion-dollar disasters than the official data.
Excluding storms under the adjusted cutoff and redoing the statistical analysis shows we gain an additional billion-dollar disaster about every 25 years, not every four years. So the frequency of these natural disasters is increasing, but not nearly as fast as the raw NOAA data suggest.
Losing the lottery
In general, people tend to overestimate the impact of small-probability events. For example, many people must think they have a pretty decent chance at winning giant lotteries; otherwise, no one would buy tickets.
Disasters are just like lotteries except people lose when their number comes up. While millions of people have been affected by Harvey, hundreds of millions more were not in the hurricane’s path. However, the news and dramatic live coverage make all of us worry that we are in danger.
Even still, given the number of costly disasters is rising – if slowly – policymakers and politicians should think about strengthening building codes and making other changes to ensure we’re better prepared and less at risk. If commercial and residential buildings are designed to handle a higher chance of being inundated by water, wind and fire the cost of cleaning up and time needed to recover from natural disasters will fall.
And what can you do? Be prepared. You never know when disaster might strike. Make a plan. Have spare water, flashlights, food and your important papers accessible in one place in case it is time to flee.
Jay L. Zagorsky is a Economist and Research Scientist at the Ohio State University.
This post firat appeard on:
Photo Credit: NASA Goddard Space Flight Center Via Flickr (CC BY 2.0)
